Identifying the swing points on the chart is an important step in identifying the possible reversal points ahead of time. In this post we will build an algorithm that will draw swing charts and identify the swing points on the chart. What I mean by swing points is the identification of support and resistance on the charts. Normally when we talk of swing points we mean that swing high or the swing low. Swing high means the bar on the left and the bar on the right of the swing high bar have highs lowers. You must have been familiar with the ZigZag indicator. ZigZag indicator is available on MT4/MT5 and can be used to identify the swings on the chart. The problem with ZiqZaq indicator is that it often repaints. We will face this problem a lot when we try to identify the swings. Did you read my earlier post on Random Forest Trading Strategy.
This is what I plan to do in this post. We will develop Swing Reversal Algorithm. Two different versions. One will use the fractal concept. More on it later. The other will not use the fractal concept. Then we will try to predict the turning points in the market using this Swing Reversal Algorithm using the AB=CD pattern. Knowing the swing points is important if we want to use Fibonacci Patterns in our trading strategy. If we can develop this Swing Reversal Algorithm we can then use it to check Fibonacci levels as well as patterns like Gartley, AB=CD, Butterfly etc. Bitcoin made history a few years back. Will bitcoin make history this year also?
This Swing Reversal Algorithm can help us remove the subjectivity stuff from drawing the swings on the charts. So we will also check if we can use these swing points for drawing Fibonacci Retracement and Fibonacci Extension levels and do we have some predictive value when we do so. We can also use this swing points to draw trendlines. Drawing trendlines is also somewhat a subjective thing but we will look into it how can reduce this subjectivity thing when drawing trendlines. Trendlines are simple yet powerful. Only if we can make an algorithm that can draw trendlines. So we will see if we can do it in this post.
By now you must have realized how much we can achieve if we can develop a swing reversal algorithm. I am calling it swing reversal algorithm you can call it swing high swing low algorithm. Name doesn’t matter. I hope you understand what I mean. We just want to develop an algorithm that will help us detect the swing highs and swing lows on the chart. You might have heard about the Gann Swing Charts. Gann is a great name in the technical analysis world. There are many people who study Gann Angles and other stuff developed by him. Gann had developed a method to identify the swing points on the chart. His method was simple. If the bars make higher highs and higher lows we have an up swing. Similarly if the bars make lower high and lower lows we have a down swing.
Peaks and Valleys Algorithm
Let’s start. First we need the concept of Nth Order Fractal. MT4 and MT5 both have fractal indicators. These are infact second order fractals. Second order down fractal is formed when we have two highs lower on the left and two highs lowers on the right of the down fractal bar. In the same manner we have a second order up fractal when we have two lows higher than the up fractal bar low on the left and two bars with lows higher than the low of the up fractal bar on the right. Just like a second order fractal we can define an nth order fractal. 4th order down fractal means we have 4 highs on the left of the down fractal bar that are lower and 4 highs on the right of the down fractal bar that are lower. Similarly 10th order up fractal means we have 10 bars on the left of the up fractal bar that have lows higher than the low of the up fractal bar and we have 10 bars on the right of the up fractal bar that have lows that are higher than the up fractal bar low. Now that you know what an Nth Order Fractal is, take a look at the following chart where I have shows the 13th order fractals on the chart.
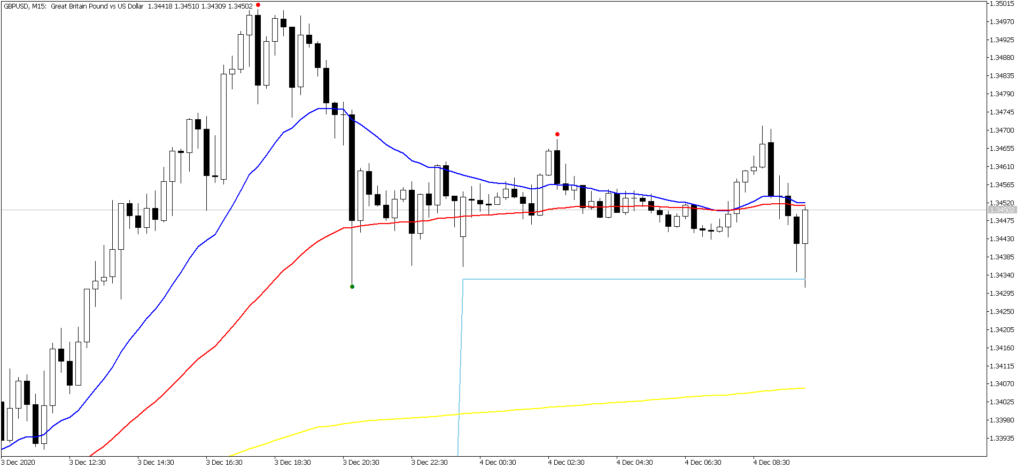
You can see three 13th order fractals on this chart. Up fractal is shown with a green dot and down fractal with a red dot. Did you notice on thing? In order to identify a fractal we have to wait for the n bars to pass. In this case we can only identify a 13th order fractal after 13 bars have formed. So once we have 13 bars formed on the right that have lows higher than the 13th order fractal bar, we will have the green dot appear on the chart. Below is the MQL5 code that I have coded to identify these Nth Order Fractal Bars.
//+------------------------------------------------------+
//| PeaksValleys.mq5 |
//| Copyright 2019, Ahmad Hassam |
//| https://www.doubledoji.com |
//+------------------------------------------------------+
property copyright "Copyright 2019, Ahmad Hassam"
property link "https://www.doubledoji.com"
property version "1.00"
property indicator_chart_window
property indicator_buffers 3
property indicator_plots 3
//--- plot Peaks
property indicator_label1 "Peaks"
property indicator_type1 DRAW_ARROW
property indicator_color1 clrRed
property indicator_style1 STYLE_SOLID
property indicator_width1 3
//--- plot Valleys
property indicator_label2 "Valleys"
property indicator_type2 DRAW_ARROW
property indicator_color2 clrGreen
property indicator_style2 STYLE_SOLID
property indicator_width2 3
input int rollingWindow=13;
int lookBack=1000;
datetime barTime;
int lowerBar;
//declare the indicator buffers
double peaks[];
double valleys[];
double arrows[];
//+------------------------------------------------------+
//| Custom indicator initialization function |
//+------------------------------------------------------+
int OnInit()
{
//--- indicator buffers mapping
//--- indicator subwindow label
IndicatorSetString(INDICATOR_SHORTNAME,
"PeaksValleys("+string(rollingWindow)+")");
//--- indicator buffers mapping
//--- set buffers as series, most recent entry at index [0]
SetIndexBuffer(0, peaks);
SetIndexBuffer(1,valleys);
SetIndexBuffer(2,arrows);
PlotIndexSetInteger(2,PLOT_ARROW, 217);
PlotIndexSetString(2,PLOT_LABEL,"H4 Close");
//---
return(INIT_SUCCEEDED);
}
//+------------------------------------------------------+
//| Custom indicator iteration function |
//+------------------------------------------------------+
int OnCalculate(const int rates_total,
const int prev_calculated,
const datetime &time[],
const double &open[],
const double &high[],
const double &low[],
const double &close[],
const long &tick_volume[],
const long &volume[],
const int &spread[])
{
//--- Setting buffer arrays as timeseries
ArraySetAsSeries(high,true);
ArraySetAsSeries(low,true);
ArraySetAsSeries(peaks,true);
ArraySetAsSeries(valleys,true);
ArraySetAsSeries(arrows,true);
//--- Checking and calculating the number of calculated //bars
if(rates_total < 250) return 0;
//--- Checking and calculating the number of calculated //bars
int limit=rates_total-prev_calculated;
if(limit>0)
{
limit=rates_total-249;
ArrayInitialize(peaks,EMPTY_VALUE);
ArrayInitialize(valleys,EMPTY_VALUE);
ArrayInitialize(arrows,EMPTY_VALUE);
}
//--- Data preparation
//check period not weekly and monthly
if(Period() < PERIOD_W1){
for(int i =lookBack ; i >=rollingWindow+1 &&
!IsStopped() ; i--)
{
if( i >= Bars(NULL,0)-1) break;

//find the peaks
if(high[i] >= iHigh(NULL,0, iHighest(NULL,0,MODE_HIGH,rollingWindow,i+1))&&
high[i] >= iHigh(NULL,0, iHighest(NULL,0,MODE_HIGH,rollingWindow,
i-rollingWindow)))
{
peaks[i]=high[i]+10*_Point;
}

//find the valleys else if(low[i] <=
iLow(NULL,0,
iLowest(NULL,0,MODE_LOW,rollingWindow,i+1))&&
low[i] <= iLow(NULL,0, iLowest(NULL,0,MODE_LOW,rollingWindow,
i-rollingWindow)))
{
valleys[i]=low[i]-10*_Point;
}
else
{
peaks[i]=0;
valleys[i]=0;
}

}//End for statement
}//End if check weekly and monthly chart
//check the chart period
if(Period() < PERIOD_H2)
{
//Check for the H8 bar close
for(int i =lookBack ; i >=0 && !IsStopped()
; i--)
{
if( i >= Bars(NULL,0)-1) break;
barTime=iTime(NULL,PERIOD_H8,i)-Period()*60; lowerBar=iBarShift(NULL,0,barTime);
}//End for statement
} //End if period check
//--- return value of prev_calculated for next call
return(rates_total);
}
//+----------------------------------------------------+
Now it is very easy for us to find the nth order fractals on the charts on MT5. We can easily write a similar script for MT4 if you trade on it. You can convert the above script for MT4. If you are unable to do it, just email me and I will send you the script for MT4. It is very easy. If you look at the above chart, you can easily find the swing points. Take a look at the chart below:
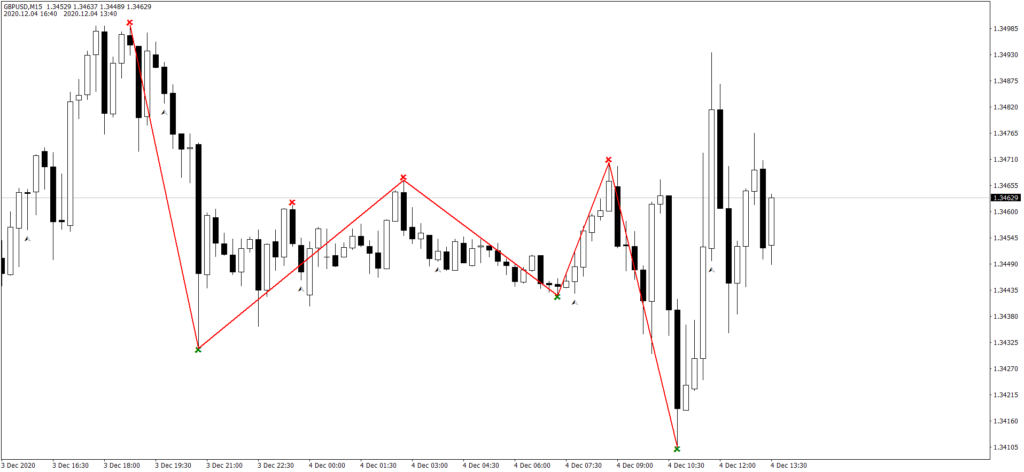
I have joined the fractals points with red line. I have used 8th order fractals in the above chart. If we use higher order fractals like 13th order we will have bigger swings. By choosing the fractals order we can make the swing big and small. Did you see one thing? There is one down fractal marked red in the above chart and after that we have another down fractal marked red. We ignored the first down fractal as it was formed at a lower higher. This I wanted to point out. We can have false swings using the fractals just like we have false swings when using the ZigZag pattern. This is a major problem if we want to use these fractals in identifying the swings on the chart. How do we solve it? I will show you two solutions in this post that you can use. I had hand drawn the swing chart. Can we do it automatically? I haven’t figured out how to do it on MT4/MT5 but I have figured out how to do it on NinjaTrader.
On NinjaTrader we use C# to code our indicators. C# is a very powerful programming language developed by Microsoft. We can do many things in C# that we cannot do in other languages. MQL4/MQL5 cannot match the power and fury of C#. The problem with MQL4/MQL5 is that these are not proper languages. These languages have been developed by MetaQuotes company for its two platforms MT4/MT5. These languages are used nowhere else. They lack data structures like lists, stacks, queues and stuff like that. These languages lack many things that are available in languages like C# and Java. When we draw the fractals we have to find a way to save these fractals bars so that we can use them later. I couldn’t find a way to do that in MQL4/MQL5 so I switched to NinjaScript. I developed the following method that look at the close of each bar for the swing points albeit the fractals.
#region Peaks and Valleysprotected void PeaksValleys(List<Tuple<double,int, int>> HighLow, PriceSeries highs,PriceSeries lows, int movingWindow,int LookBackPeriod, int _swings){if (HighLow == null){throw new ArgumentNullException("HighLow");}for (int k = movingWindow; k <= LookBackPeriod - movingWindow; k++){//find the peaks if ((highs[k] >= MAX(highs, movingWindow)[k + 1]) && (highs[k] >= MAX(highs, movingWindow)[k - movingWindow])){ HighLow.Add(Tuple.Create(highs[k], k, -1));//check if we have two consecutive peaksif (HighLow.Count > 1 &&HighLow[HighLow.Count - 1].Item3 == -1){if (HighLow[HighLow.Count - 2].Item3 == -1){ //check if we have two consecutive peaks//check which peak is higher//remove the lower highif (HighLow[HighLow.Count - 1].Item1 >= HighLow[HighLow.Count - 2].Item1){HighLow.RemoveAt(HighLow.Count - 2);} //end if elseif (HighLow[HighLow.Count - 1].Item1 < HighLow[HighLow.Count - 2].Item1){HighLow.RemoveAt(HighLow.Count - 1);} }//End if check last two values are same}//End if the list count is greater than 1 }//end if// find the bottomselse if ((lows[k] <=MIN(lows, movingWindow)[k + 1])&& (lows[k] <MIN(lows, movingWindow)[k - movingWindow])){HighLow.Add(Tuple.Create(lows[k], k, 1));////check if we have two consecutive valleys////check which valley is lower////remove the higher lowif (HighLow.Count > 1 &&HighLow[HighLow.Count - 1].Item3 == 1){//check if we have two peaks or two valleysif (HighLow[HighLow.Count - 2].Item3 == 1){if (HighLow[HighLow.Count - 1].Item1 <= HighLow[HighLow.Count - 2].Item1) { HighLow.RemoveAt(HighLow.Count - 2);} //end ifelse if (HighLow[HighLow.Count - 1].Item1 > HighLow[HighLow.Count - 2].Item1){ HighLow.RemoveAt(HighLow.Count - 1);}}//End if we have two consecutive valleys}//End if check list has count greater than 1}//End if find bottomsif (HighLow.Count > 1){//check if the valley is higher than the peakif (HighLow[HighLow.Count - 1].Item3 == -1 && HighLow[HighLow.Count - 2].Item3 == 1){if (HighLow[HighLow.Count - 2].Item1 > HighLow[HighLow.Count - 1].Item1) { HighLow.RemoveRange(HighLow.Count - 2, 2);}} //End if check trough is higher than peak//check if the peak is higher than the troughelse if (HighLow[HighLow.Count - 1].Item3 == 1 && HighLow[HighLow.Count - 2].Item3 == -1){if (HighLow[HighLow.Count - 2].Item1 < HighLow[HighLow.Count - 1].Item1){HighLow.RemoveRange(HighLow.Count - 2, 2);}} //End if check trough is higher than peak}// End if check we have count greater than 1//Stop if we have the required number of swingsif (HighLow.Count >= _swings) break;} // close for loop//check if we have a false peakif (HighLow[0].Item3 == -1){if (highs[1] > HighLow[0].Item1){HighLow.RemoveAt(0);}}//check if we have a false troughelse if (HighLow[0].Item3 == 1){if (lows[1] < HighLow[0].Item1){HighLow.RemoveAt(0);}}} #endregion
In the above method I checked if we had two consecutive swing highs or two consecutive swing lows. I also checked whether we have a false swing high or a false swing low. Now we can find the swings on the chart and save them in a list. We start from the left instead of the right. Left means we start from the most recent close and go right and stop when we have the required number of swings that we want. Most of the time 5 swing points will be sufficient for us. AB=CD needs 4 swing points. Gartley pattern needs 5 swing points. If we want to draw a trendline we need at least 3 swing points and so on. As I said above the above PeaksValleys algorithm starts from the left. We can run it at the close of each bar to find the required number of swing points. We need to develop more methods that we can use to identify AB=CD pattern or the Gartley pattern. We also need to create a method that can draw trendlines. We will do that below. One problem that I encountered with this PeaksValleys algorithm was that on each chart we might be using the same number of bars but we will get different length swings which can be good as well as bad.
Swing Reversal Algorithm
Swing Reversal Algorithm looks for price movements. For example it will look for a 50 pip move in the up direction before it will change direction. As long as the price does not make a 50 pip move in the down direction, Swing Reversal Algorithm will not change direction. When the price moves 50 pips in the down direction it will change direction to down. Swing Reversal Algorithm is timeframe independently. Just choose your swing amount. It can be 20 pips, 30 pips, 50 pips, 70 pips, 100 pips, 200 pips whatever. The algorithm will show the same swings on all timeframes whether it is 5 minute, 15 minute 30 minute, 60 minute whatever. The swing depend on the swing amount. So the swings will be same on all timeframes. This can help a lot because we have the same swings on all charts. This is unlike the Peaks and Valleys algorithm that has swings depending on the number of bars on each chart. Below is the code for the Swing Reversal Algorithm:
#region Swing Reversal Algorithm
protected static void SwingReversalAlgorithm(ref List<Tuple<double, int, int>> Swing,
ref PriceSeries highs, ref PriceSeries lows,
ref PriceSeries closes,
int lookBack, int reversalAmount, double pip)
{
   if (highs == null)
{
    throw new ArgumentNullException("highs");
}

if (lows == null)
{
    throw new ArgumentNullException("lows");
}

if (closes == null)
{
    throw new ArgumentNullException("closes");
}

if (Swing == null)
{
    throw new ArgumentNullException("Swing");
}

//Initialize first swing pair			Swing.Add(Tuple.Create(closes[lookBack + 1],
lookBack + 1, 0));
//Initialize first direction
double _boxSize = pip;
int _direction = 0;
int j = 0;

for (int i = lookBack; i > 0; i--)
{
if (highs[i] >= highs[lookBack + 1])
{					Swing.Add(Tuple.Create(highs[i], i, 1));
_direction = 1;
j = i;
break;
}

else if (lows[i] <= lows[lookBack + 1])
{
					Swing.Add(Tuple.Create(lows[i], i, -1));
_direction = -1;
j = i;
break;
}
}

for (int i = j - 1; i > 0; i--)
{
if (_direction == 1)
{
if (highs[i] > Swing[Swing.Count - 1].Item1)
{
Swing[Swing.Count - 1] = Tuple.Create(highs[i], i, 1);
}

else if (Swing[Swing.Count - 1].Item1 - lows[i]
>= _boxSize * reversalAmount)
{
_direction = -1;
Swing.Add(Tuple.Create(lows[i], i, -1));
}
}
else if (_direction == -1)
{
if (lows[i] < Swing[Swing.Count - 1].Item1)
{
Swing[Swing.Count - 1] =
Tuple.Create(lows[i], i, -1);
}
else if (highs[i] - Swing[Swing.Count - 1].Item1
>= _boxSize * reversalAmount)
{
_direction = 1;
Swing.Add(Tuple.Create(highs[i], i, 1));
}
}
}
}
#endregion
This is the first version of the Swing Reversal Algorithm. It moves from left to right meaning it starts from 500 bar say and then calculates the swings and ends at bar 0. We can also code a swing reversal algorithm that works from right to left and stops when we have the required number of swings. This can be more efficient as we will have to calculate the swings at the close of each new bar. For example we only need 5 swings looking back from the latest bar. Instead of looking 1000 bars each time we can stop when we have 5 swings which can be just after 200 bars. I changed this swing reversal algorithm below:
#region Swing Points
protected void SwingPoints(List<Tuple<double, int, int>> Swing, PriceSeries highs,
PriceSeries lows, int lookBack,
int reversalAmount, int _swings)
		{
if (highs == null)
{
throw new ArgumentNullException("highs");
}

if (lows == null)
{
throw new ArgumentNullException("lows");
}

if (Swing == null)
{
throw new ArgumentNullException("Swing");
}

//Initialize first direction
double _boxSize = PipPoint();
int _direction = 0;
int j = 0;

for (int i = 1; i < lookBack; i++)
{
if (highs[i] > highs[0])
{
Swing.Add(Tuple.Create(highs[i], i, -1));
_direction = -1;
j = i;
break;
} //End if highs

else if (lows[i] < lows[0])
{
Swing.Add(Tuple.Create(lows[i], i, 1));
_direction = 1;
j = i;
break;
} //End if lows
}
for (int i = j + 1; i < lookBack; i++)
{
if (_direction == -1)
{
if (highs[i] > Swing[Swing.Count - 1].Item1)
Swing[Swing.Count - 1] = Tuple.Create(highs[i], i, -1);
}

else if (Swing[Swing.Count - 1].Item1 - lows[i]
> _boxSize * reversalAmount)
{
_direction = 1;
Swing.Add(Tuple.Create(lows[i], i, 1));
} // End if direction is -1

else if (_direction == 1)
{
if (lows[i] < Swing[Swing.Count - 1].Item1)
Swing[Swing.Count - 1] = Tuple.Create(lows[i], i, 1);
}
else if (highs[i] - Swing[Swing.Count - 1].Item1
> _boxSize * reversalAmount)
{
_direction = -1;
Swing.Add(Tuple.Create(highs[i], i, -1));
}
} // End if direction is 1

//check if we have the required swings
if (Swing.Count >= _swings) break;
} // End for statement looping over the bars
}
#endregion
As you can see above Swing Reversal Algorithm version is much more efficient. At the close of each new bar we can run this algorithm and get the list of swing points. This list is valid for the this bar only. When a new bar closes we run this algorithm again. Now we can use this algorithm to find swings that have at least a certain pip movement for example it can 50 pips, 100 pips or even more. If you are looking for 20-30 pip movement, you can even do that. You can even have a 10-15 pip swing. But the smaller the pip movement the more noise we have. So I mostly use 50 pips as a minimum swing amount as I want to make a minimum of 50 pips per trade. Using 50 pips as the minimum swing size means you will get the new swing point after the 50 pip swing reversal is over. So you will be either 50 pips above or below the new swing point. We can use Fibonacci levels to predict the reversal using the last swing. We can also use chart patterns like AB=CD or the Gartley Pattern to predict the new reversal points.
Just keep this in mind. No chart pattern is perfect. These chart patterns break down frequently. If you believe in the Efficient Market Hypothesis, price is a random movement and it has been shown by finance academics that even random price series can exhibit these chart patterns. Random time series can show trends. Random time series can show head and shoulder pattern and so on. Then how do we know this chart pattern is noise and not a real signal. We look in this issue in more detail below. Financial markets are full of mirages. There is so much noise. The challenge lies in sifting the chaff and finding a good trading signal that can make 100-200 pips with a small stop loss of 10-15 pips. Everything revolves around this challenge: can we consistently make 100-200 pips per trade with a small stop loss of 10-15 pips? Can be consistently make 300-500 pips per week with a small stop loss of 10-15 pips per trade?